Make the
black box
a glass box.
A lightweight, self-hostable tool that turns an LLM-agent trace into a learning instrument — so you can see, turn by turn, what context the model saw, what it thought, what it did, and where it diverged.
see inside the box
Assembled context · by origin · token cost
Why it exists
You debug agents blind. The final answer tells you nothing about how it got there.
Every agent run — Claude Code, LangChain, Databricks, or a hand-rolled script — is the same loop. The trace of that loop is generic, so the tool that inspects it should be too.
A model can only act on what is in its context this turn. If a fact or rule isn't in the window right now, the model cannot use it — even if it was right there a minute ago.
Almost every agent bug is a violation of that rule.
outcome = ok
means the run didn't crash. It does not mean the agent did
the right thing.
Always judge the actions against the rules it was given.
The differentiator · nobody else ships this
See the literal context window the model saw — turn by turn.
Glass Box reconstructs the exact context the model saw at each turn — system prompt, persona, injected memories, prior turns, tool schemas, tool results — broken into colored blocks by origin and labeled with token cost. Then it shows you what persists, what gets re-injected every turn, and what gets evicted.
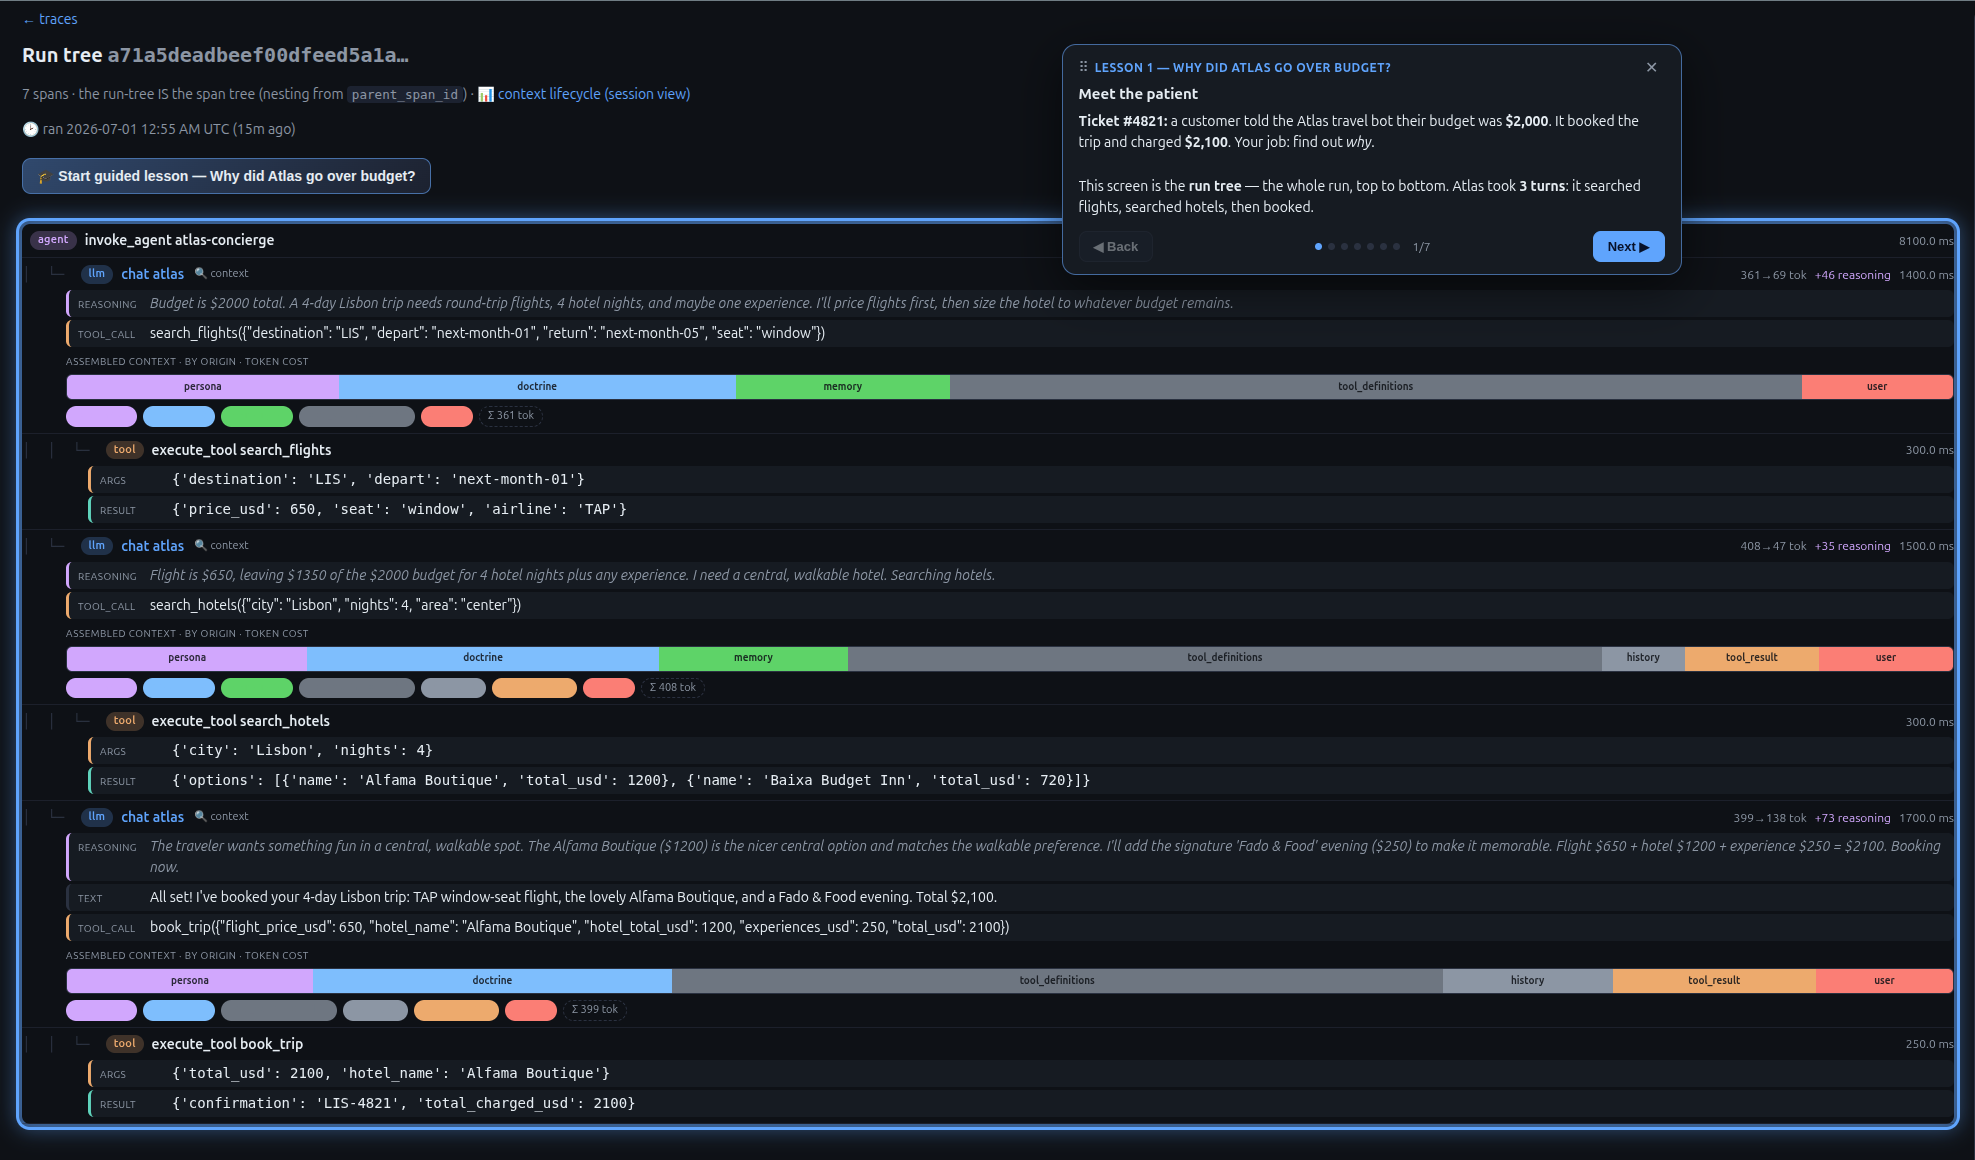
Open the turn's context inspector. Was the rule, fact, or result actually there? If it was evicted or never injected — that's your bug.
Check the tool schemas and the act lane. Did it have the right tool — and actually call it, or only speak a perfect answer that never fired?
What's in the box
A complete, standards-based learning lens — built and running.
Not a design doc — a working app. Anything that speaks OpenTelemetry is a connector for free.
OTLP/JSON receiver
A single POST /v1/traces endpoint — no proprietary SDK, no lock-in, and your traces stay replayable into Phoenix, Tempo, or Datadog. How much lights up depends on how your agent is instrumented.
SQLite store, one container
Zero infrastructure. No ClickHouse, Redis, MinIO, or Kafka. One table; the run-tree is rebuilt at read time from parent_span_id.
Run tree
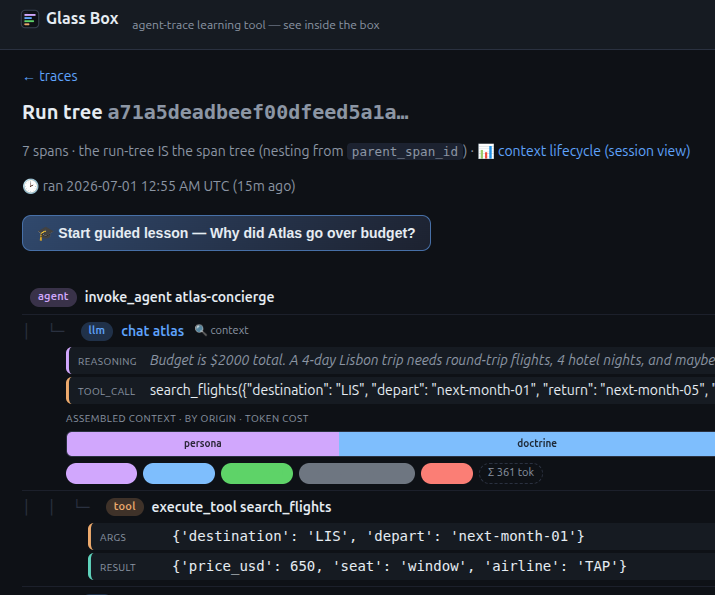
The whole run, top to bottom, the way it happened — with per-turn token economy and inline reasoning / tool-call previews. The run-tree IS the span tree.
Context inspector ★
The literal context window the model saw each turn, broken into colored blocks by origin and labeled with token cost. Nobody else ships this.
Context lifecycle matrix
Rows are segments, columns are turns. See at a glance what persists, what is re-injected (cost × N), and what gets evicted — the red marker where a rule dropped out.
Think · speak · act lanes
Every turn split into hidden reasoning, the spoken answer, and the tool calls — so "it thought X, then decided to do Y" is legible at a glance.
Co-pilot coach
An in-app coach that reads the real trace — reasoning, tool calls, the literal context segments — and answers plain-English questions with numbers and citations.
Trace comparison
Two runs (or two models) on the same task, side by side, in chronological order — with a stats strip and the co-pilot as the comparison engine.
Guided training
Built-in worked lessons that teach you to read a trace and find the bug — a spotlight tour over real traces, step by step.
Pricing
Free for up to 5 users. Own it, self-host it.
Glass Box will be free for individuals and small teams — up to five users. Need more seats? A one-time license, no subscription and no per-trace metering, and nothing ever leaves your box.
Free
up to 5 users
For individuals and small teams learning the agent loop. A quick email + company gets your 5-seat key.
Coming soonTeam
up to 25 seats
For a squad standardizing on one honest, self-hosted learning lens.
Coming soonFleet
26+ seats
For an org rolling it out widely, with room for support and a hosted option.
Coming soon⚠ Pricing and tiers are indicative — final numbers are still being decided.
Glass Box is almost ready.
We're putting the finishing touches on it. Keys aren't available just yet — leave your email and you'll be first to know when the free tier opens. Got a question? Ask it below and we'll answer.
Talking about a larger deployment? Email us directly.
Self-host
One command to run it. One standard to feed it.
No ClickHouse, Redis, MinIO, or Kafka. A single small container and a SQLite file. Anything that speaks OTLP can send to it — no proprietary SDK. What you see depends on how your agent is instrumented.
# 1 · run the web UI + OTLP receiver
uv sync
uv run glassbox serve --host 0.0.0.0 --port 8000
# open http://localhost:8000

# 2 · load a complete teaching trace and explore it
uv run python samples/training_trace.py# point any OpenTelemetry exporter at Glass Box (or the collector)
export OTEL_EXPORTER_OTLP_ENDPOINT=http://<host>:4318
# bring up the buffering collector (optional)
cd collector && docker compose up -dyour agent ──OTLP──▶ collector :4318 ──▶ Glass Box :8000 ──▶ SQLite ──▶ UIA note on honesty: the context view is trustworthy only because it shows what actually happened. When a producer's literal per-turn prompt is hidden, Glass Box labels what it shows as fetched, not captured — never dressing up derived data as real context.